Project
Track your entire stock portfolio, monitor symbol watchlist and run technical analysis all in one in a modern browser-based dashboard available at https://finance.bonzaiengine.com.
Please visit my patreon page to get more informations and support its development.
Screenshots
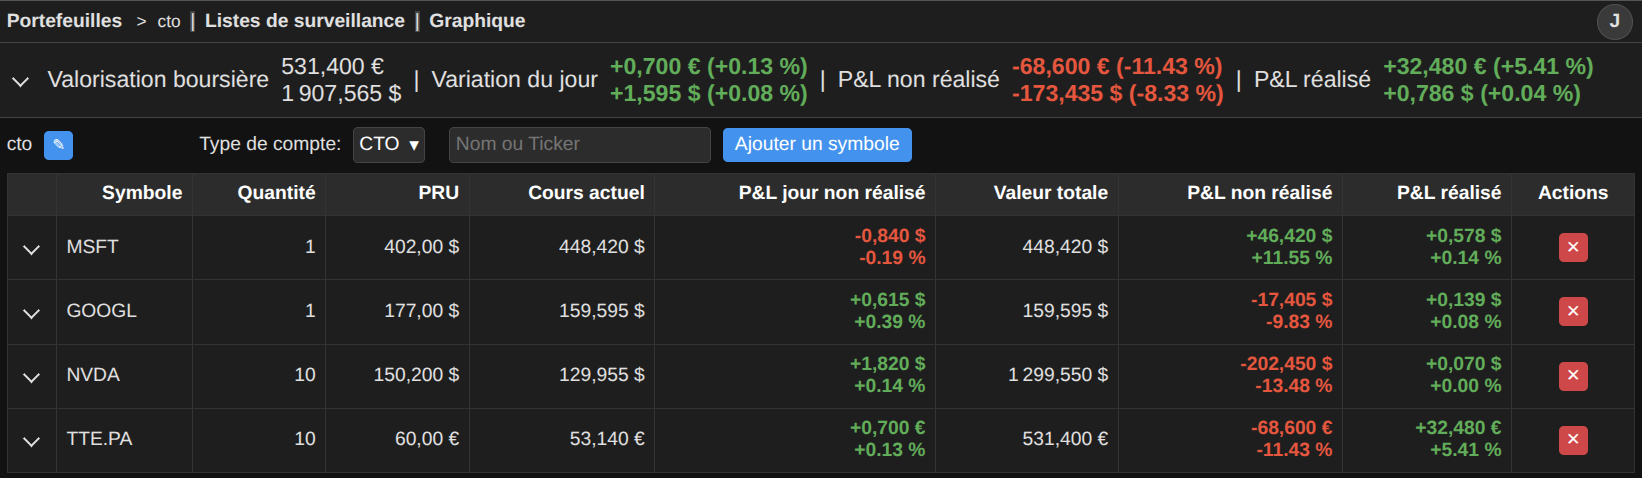
Portfolio board
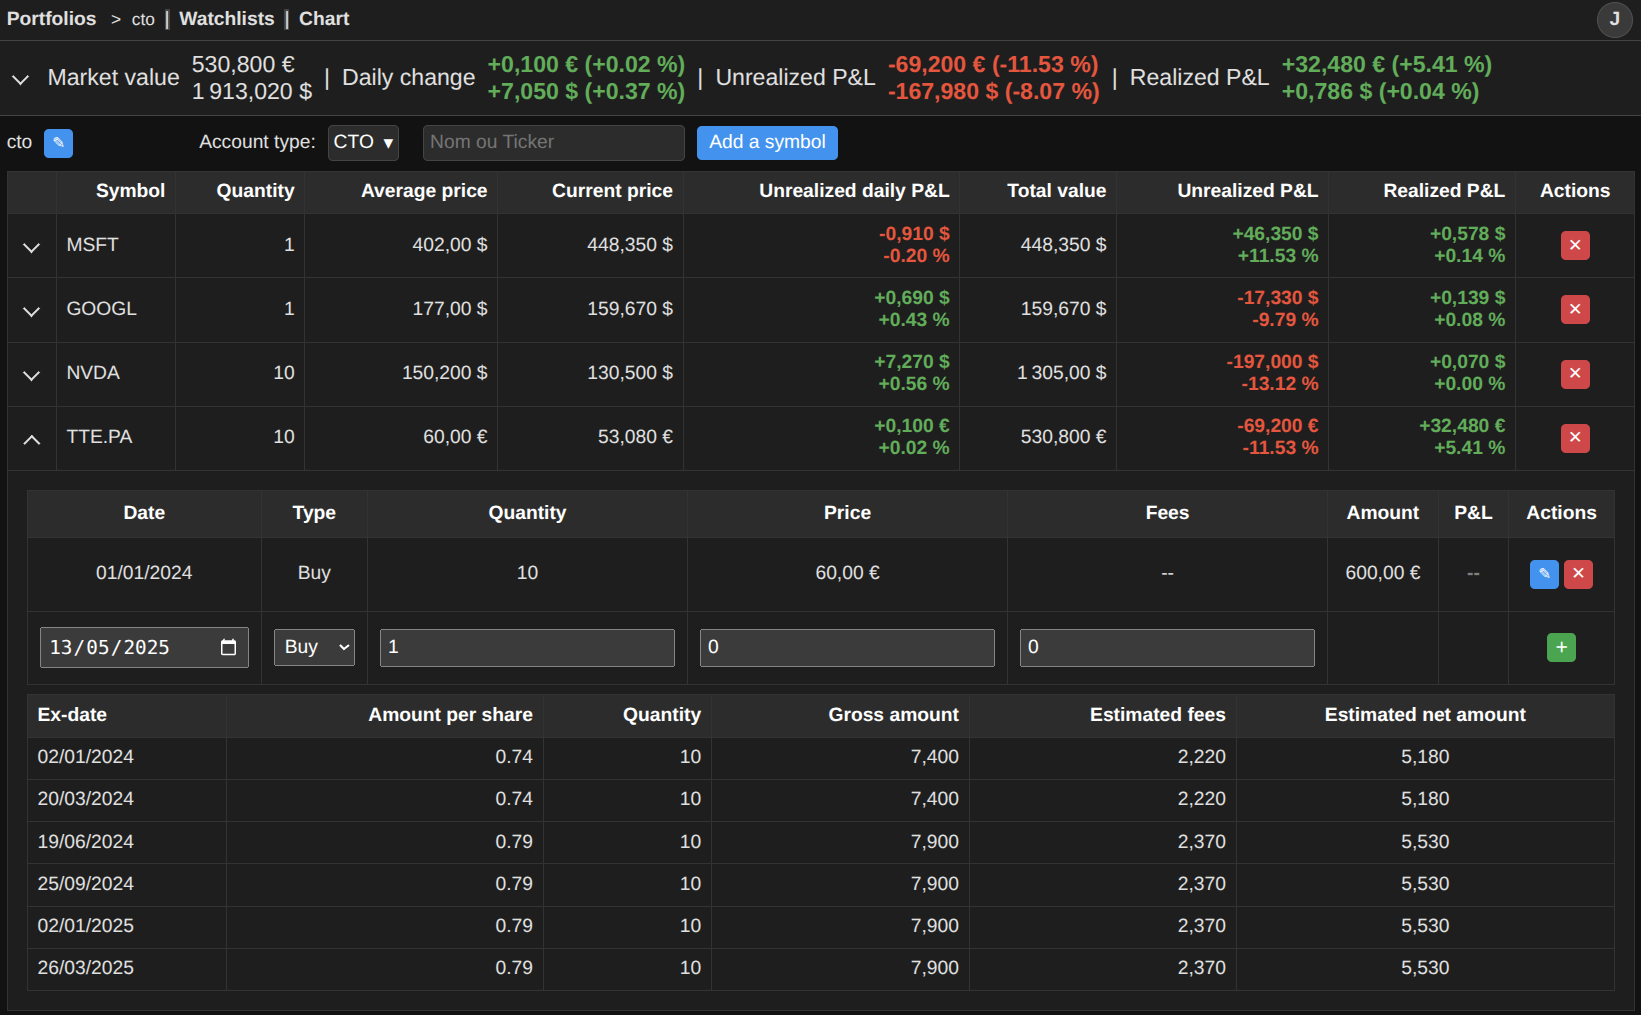
Stock transactions
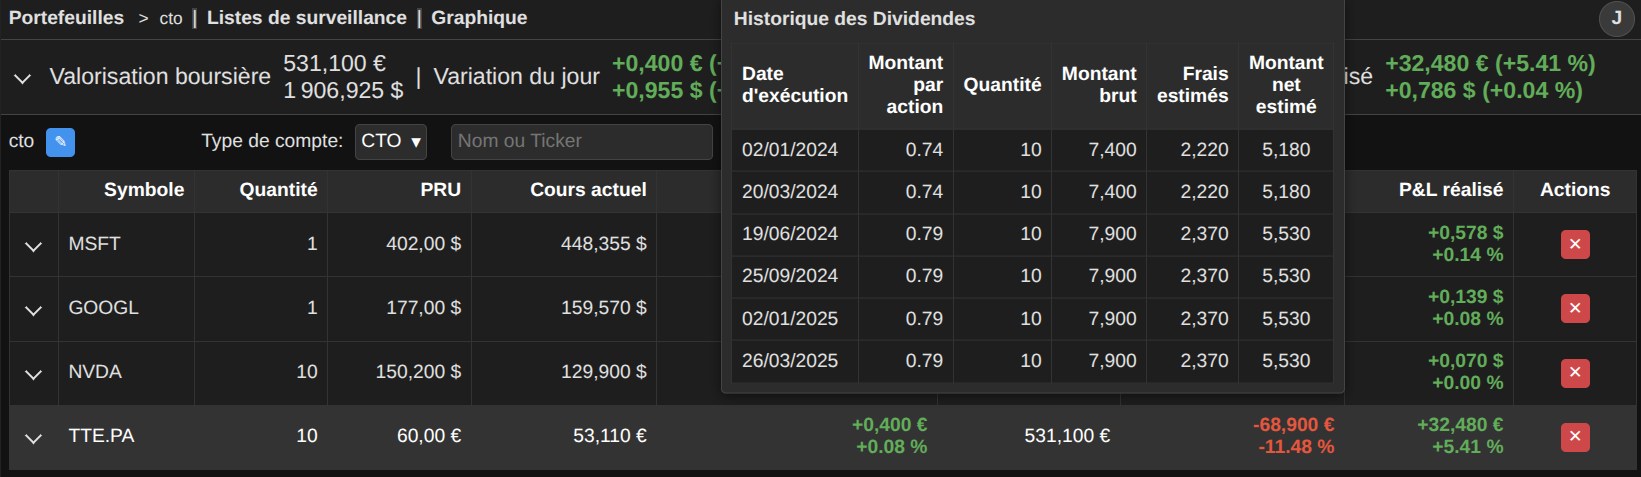
Position dividends
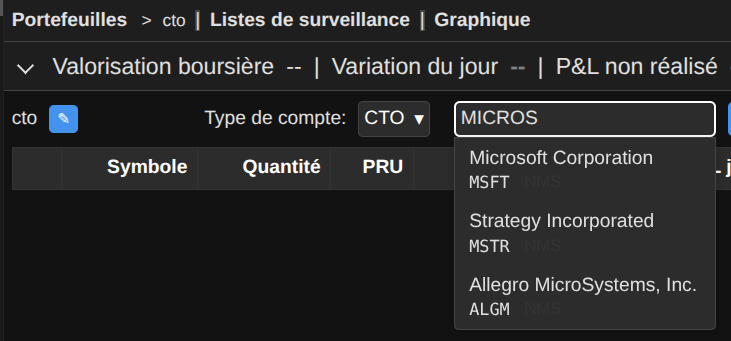
Stock search
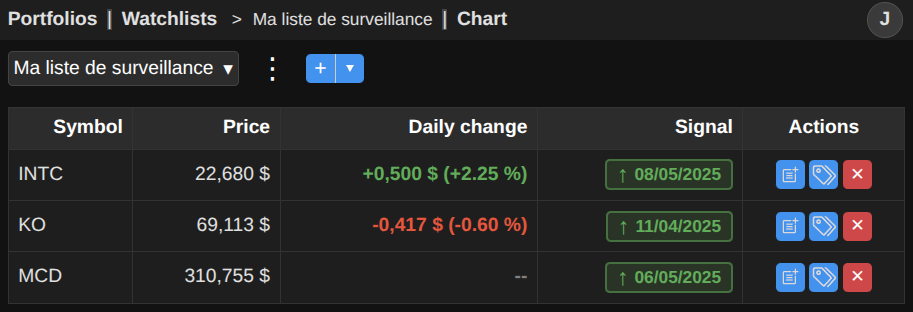
Watchlist board
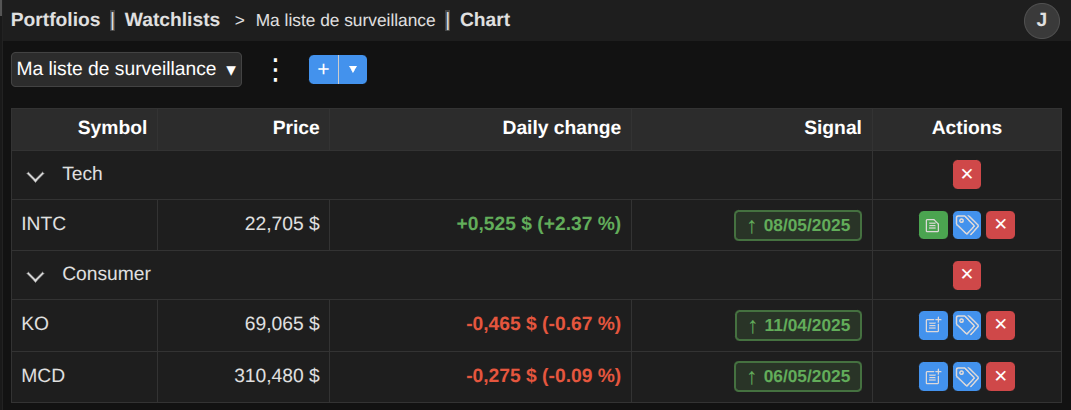
Grouping
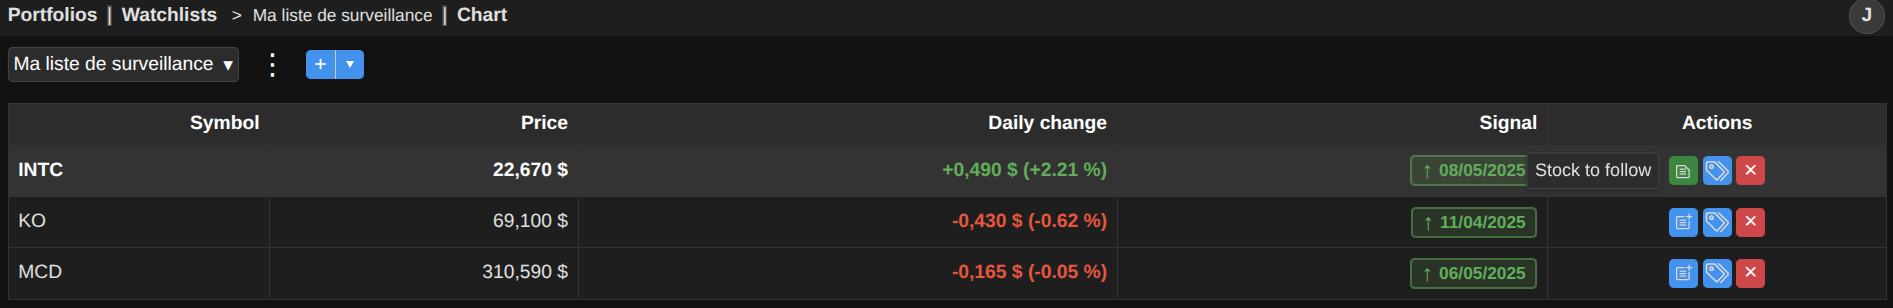
Stock comment
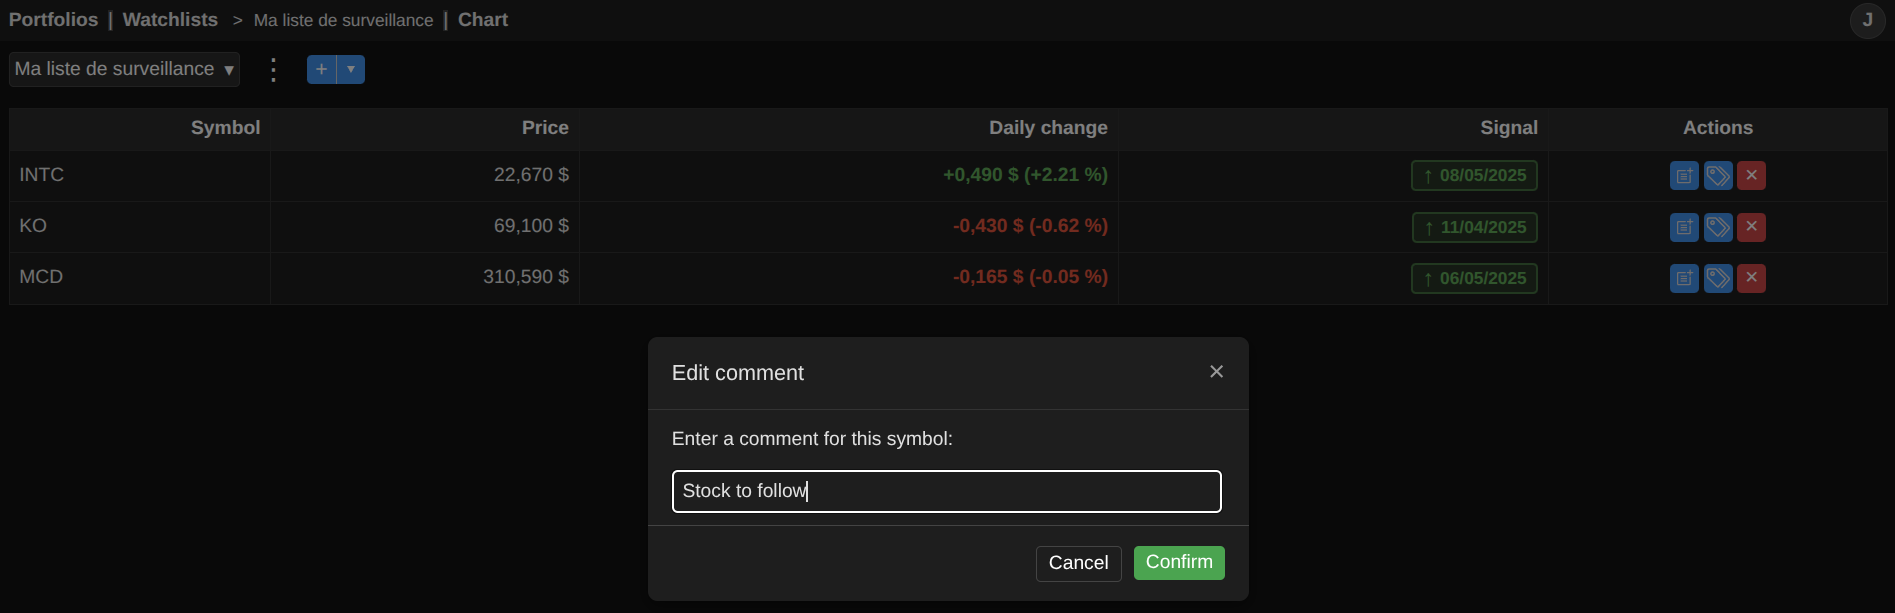
Stock comment edition
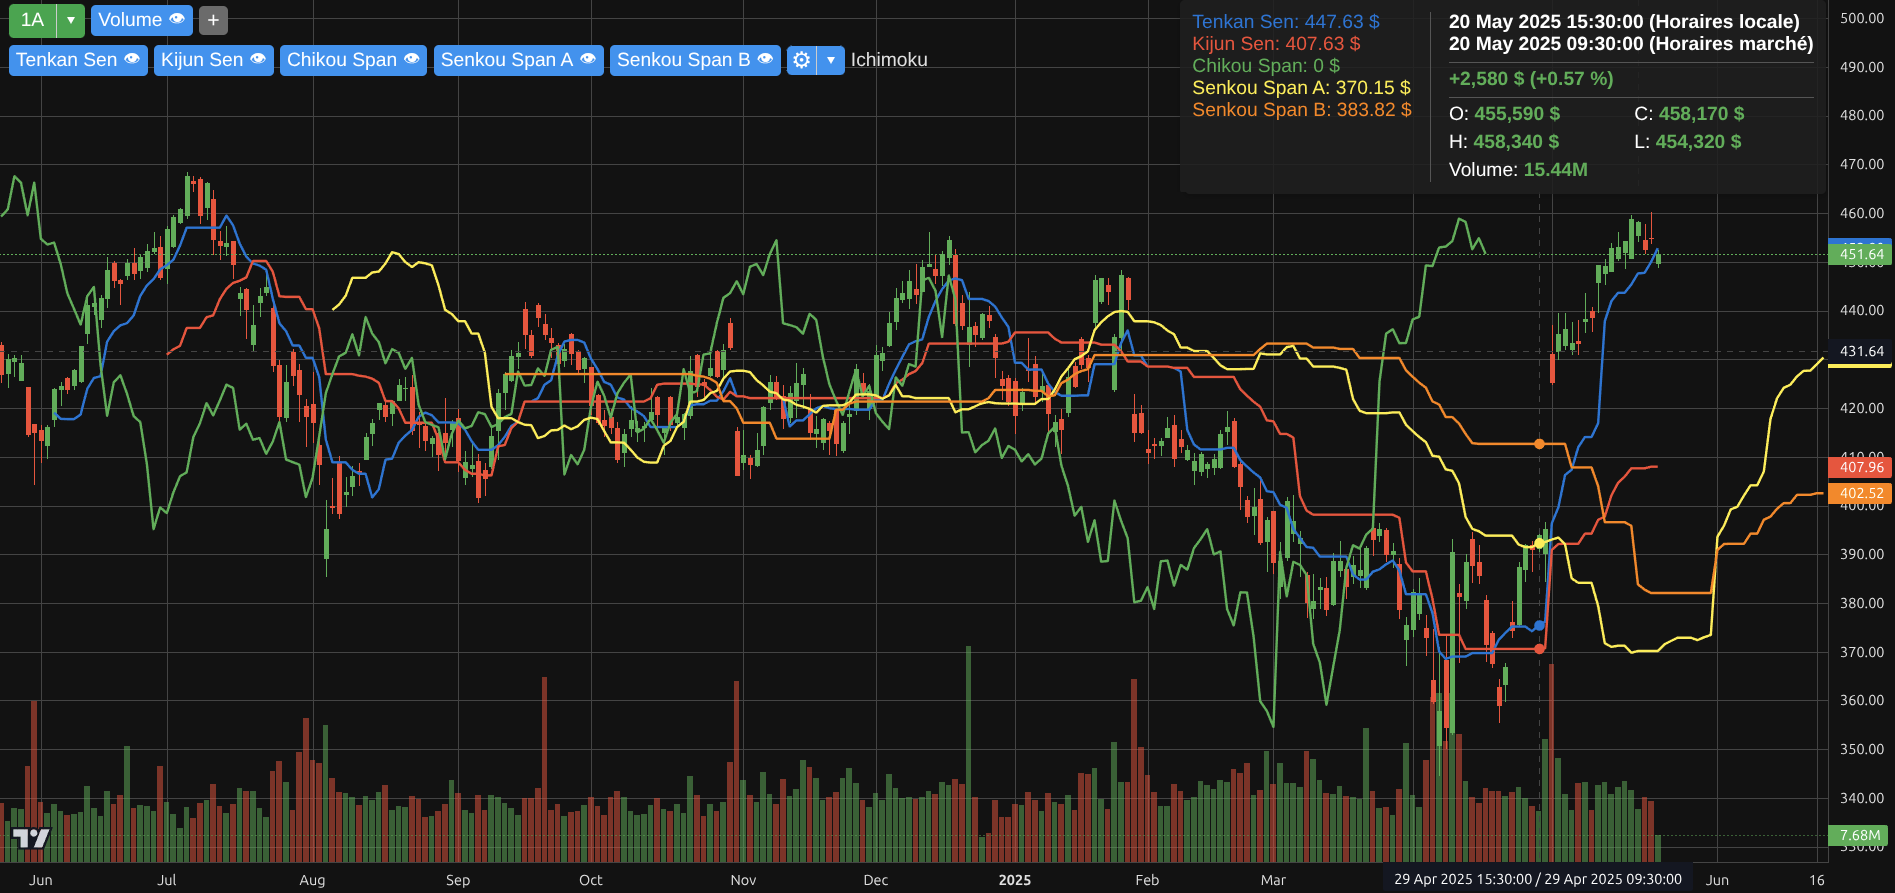
w/ Chart
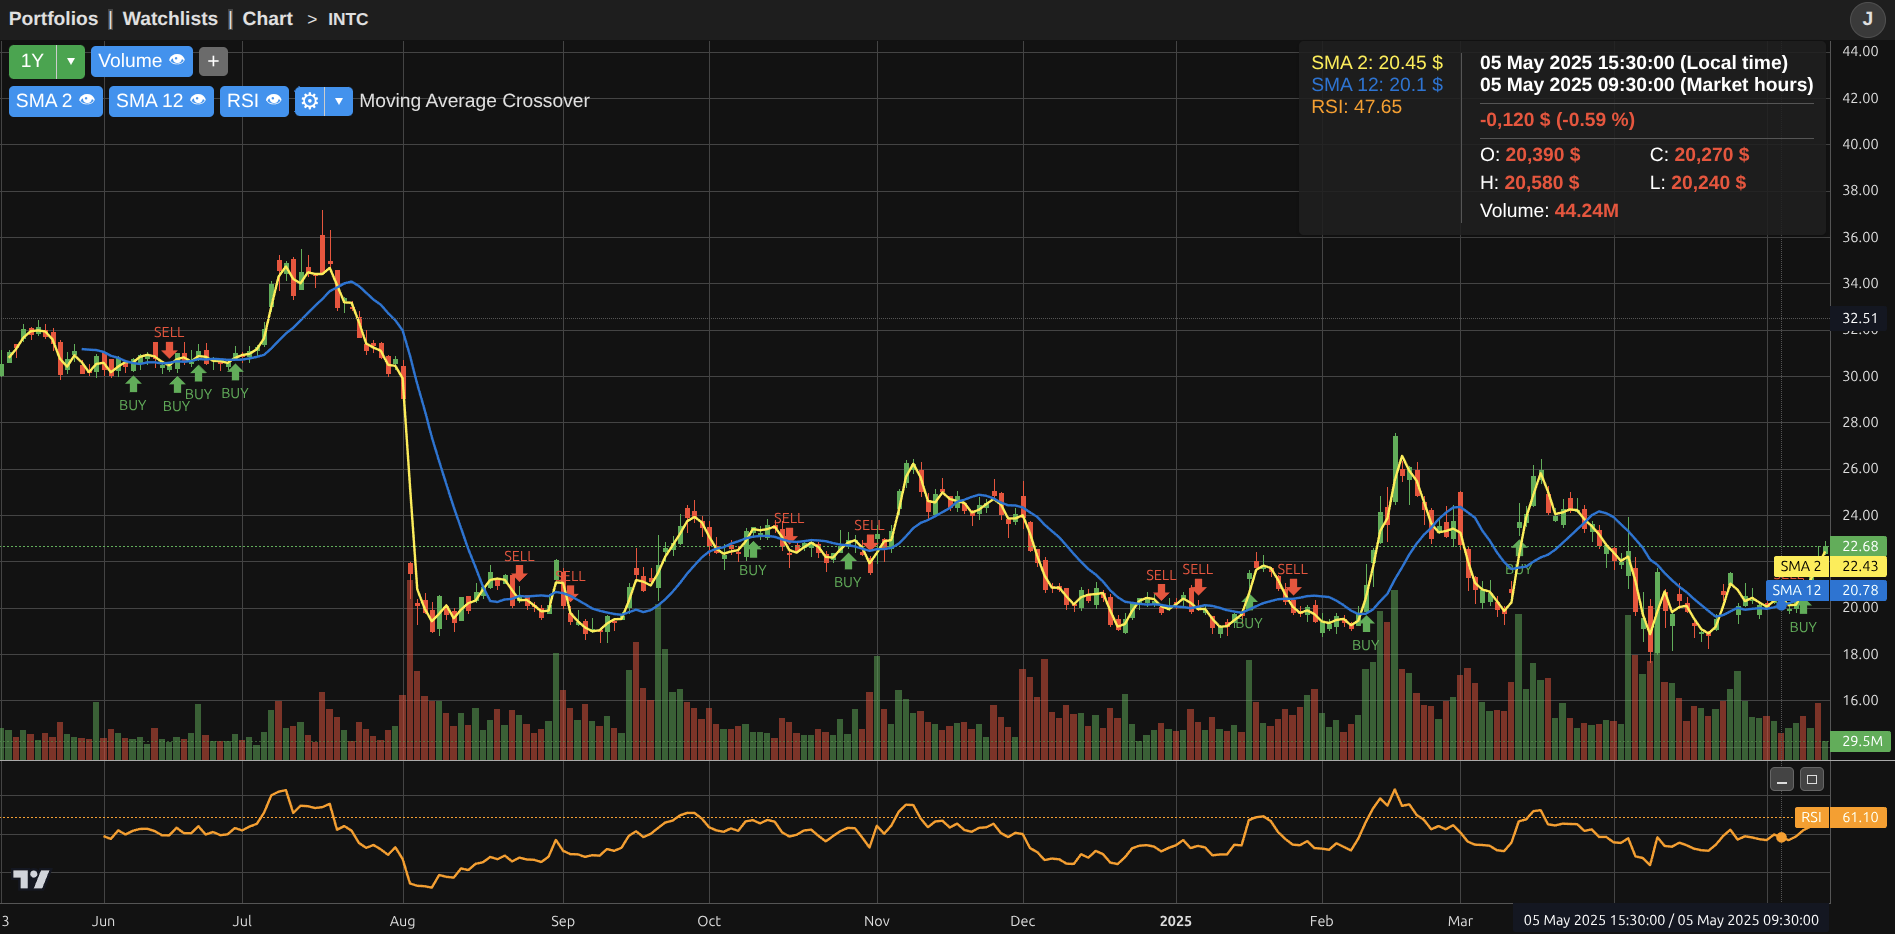
Technical analysis - SMA
Moving average & signal crossing
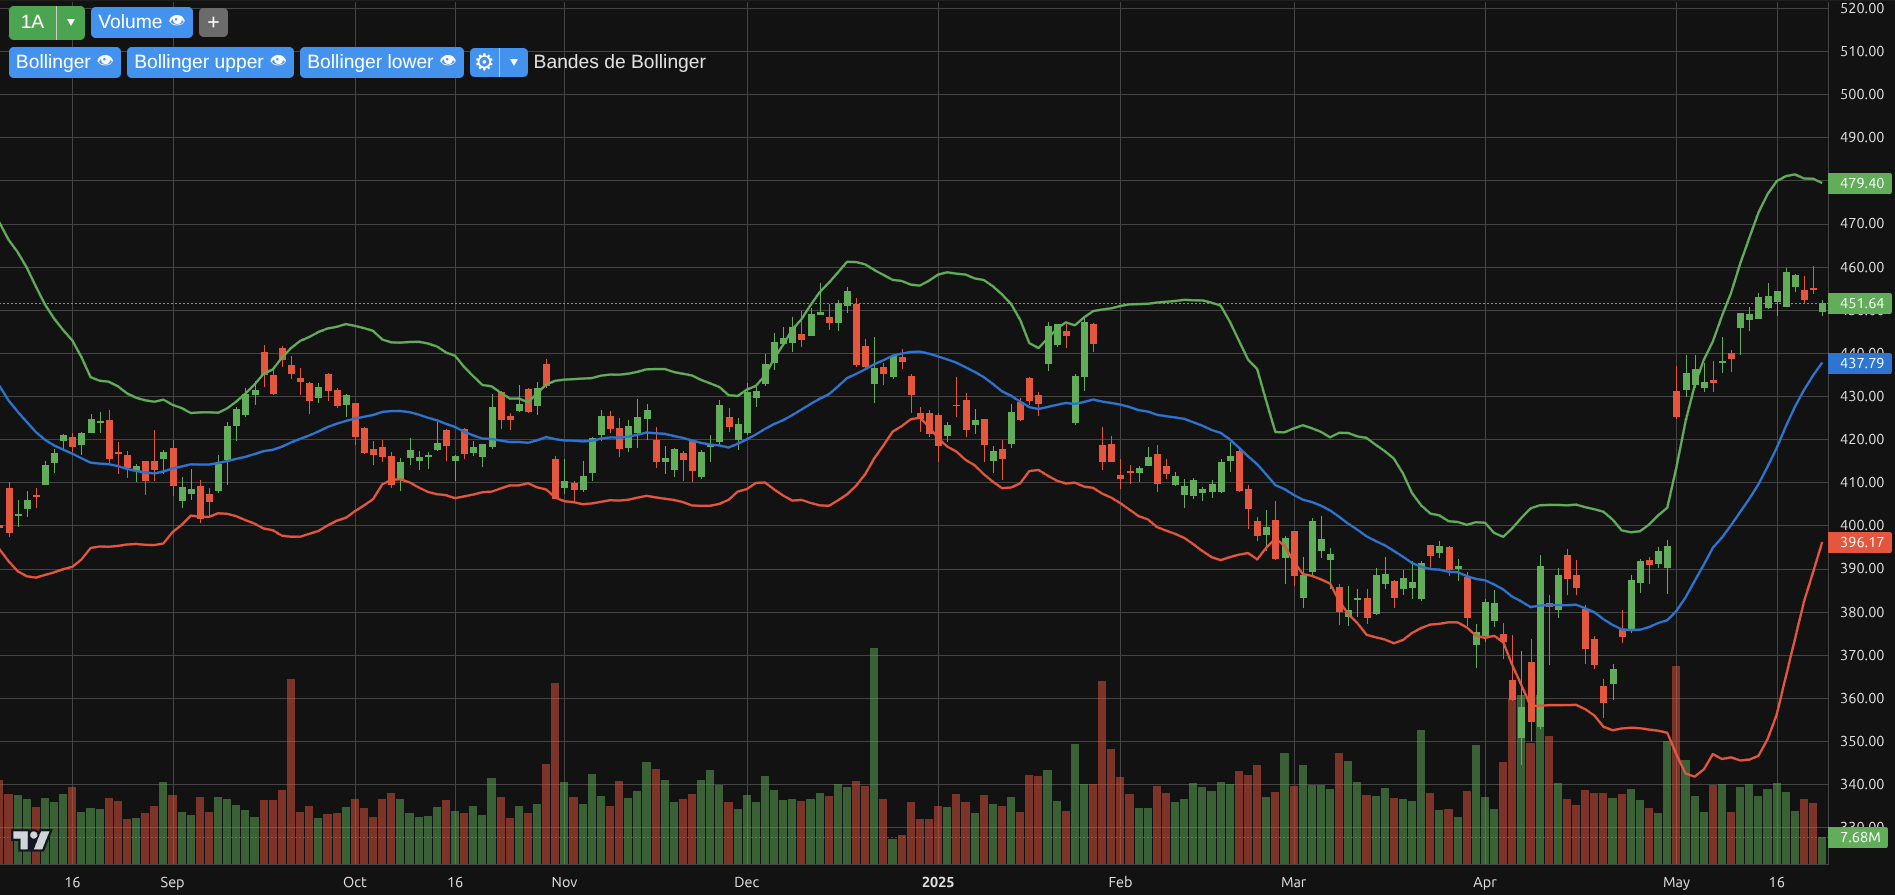
Technical analysis - Bollinger
Bollinger Bands [Beta]
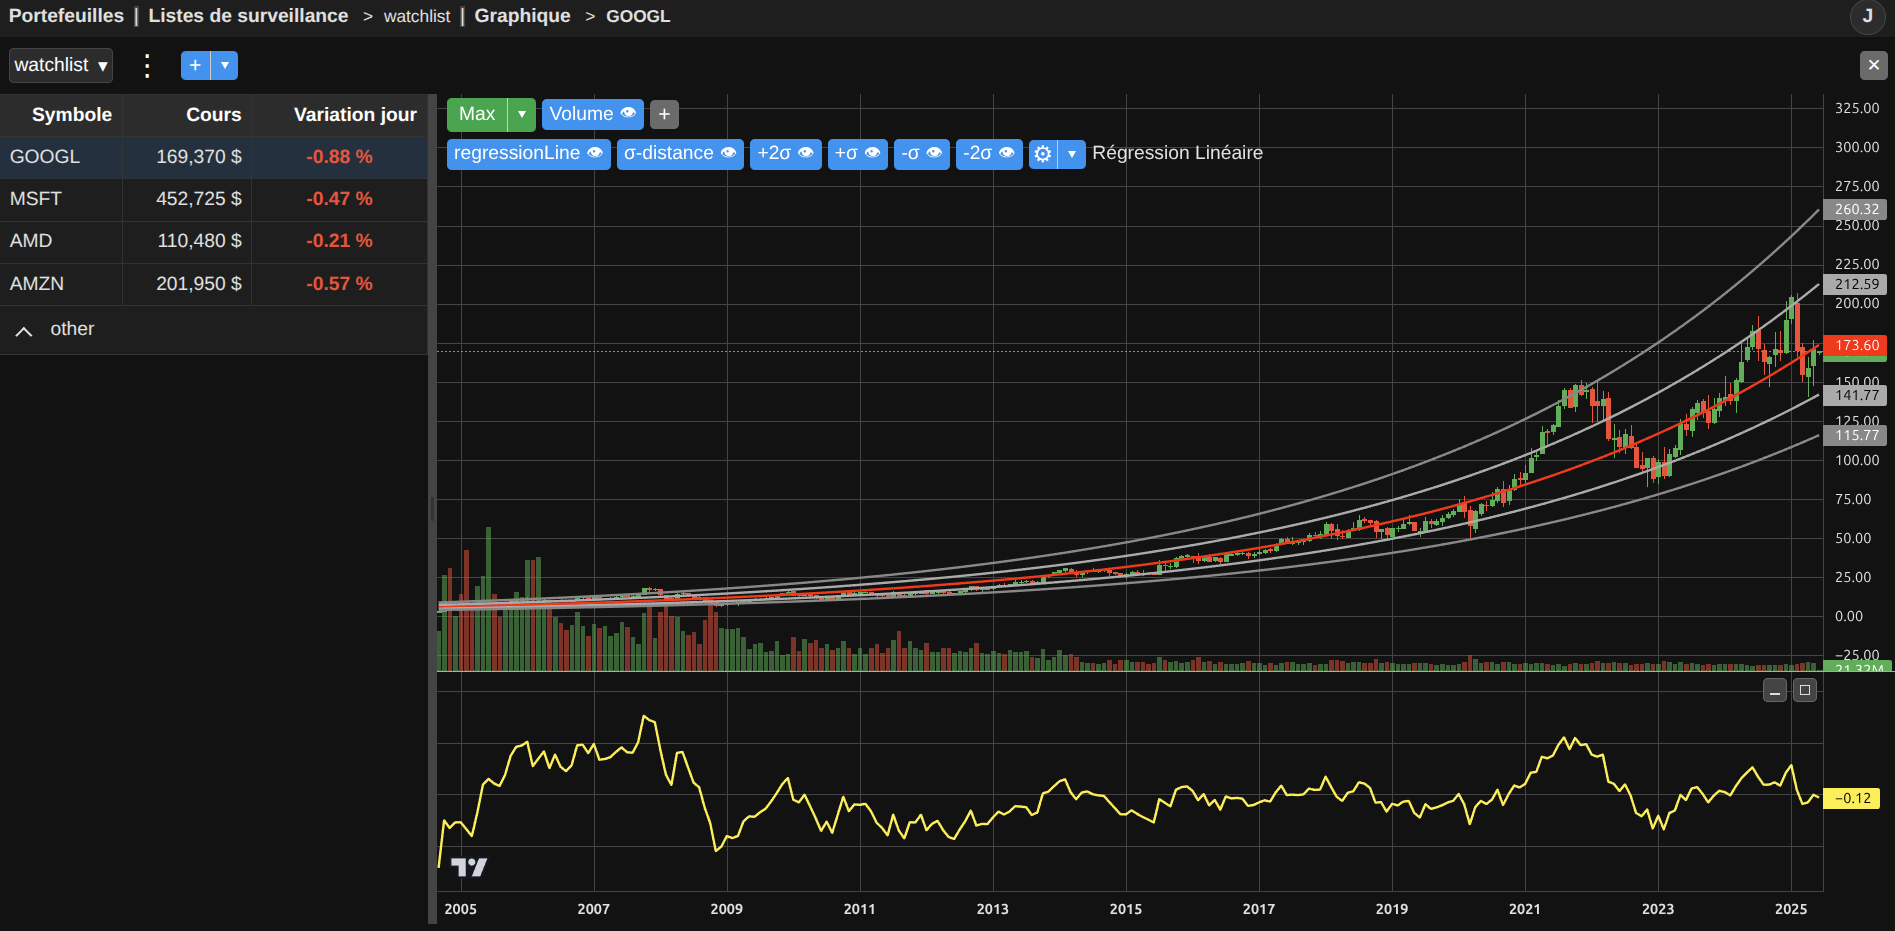
Technical analysis - Ichimoku
Ichimoku Cloud [Beta]
![Chart drawing tools [Beta]](./images-patreon/finance/wip.png)
Chart drawing tools [Beta]
[Under development] Trend, parallel channel, ...
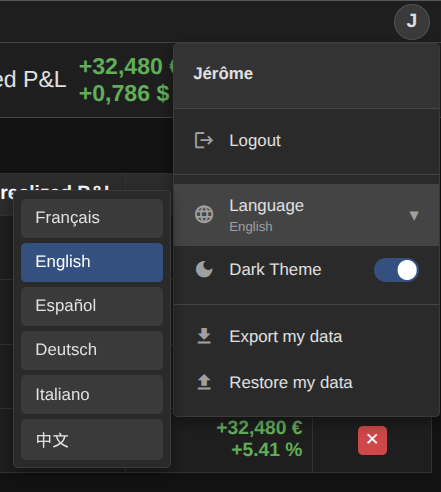
User menu
Data export, UI theme, language
Features
- Portfolio tracking
- Multi-currency CTO & PEA stock portfolios
- Transaction buy & sell
- P&Ls: daily, unrealized, realized, dividend tracking
- Stock : dividend history, exchange trading hours and open days
- Chart & Technical analysis
- OHLC chart (open-high-low-close chart), Volume
- Candlestick, Line, histogram
- Technical indicators: Moving Average crossing, Bollinger Bands, Ichimoku, Linear regression / standard deviation, ...
- Drawing tools: trend, parallel channel, ...
- Monitor watchlist
- Multiple watchlist
- Stock list, categories, note
- Daily change
- Technical indicator signal
- UI functionalities
- User data export and import
- Dark & Light [beta] themes
- Multi-language support
Roadmap
Done :
- To be completed
In-progress :
- Chart drawing tools
- To be completed
Todo :
- Patreon request
- Multi-browser synchronization
- Stock price alert
- ...
Technology
The software is developed using Angular, lightweight-charts, Node.js, Git and VS Code.
patreon.bonzaiengine.com - Copyright © 2020-2026 Jérôme Jouvie - All Rights Reserved.